
ROS 2 & Robot Software Architecture (Fundamentals) · Lesson 11
ROS 2 Tools & CLI
Est. 50–70 min
Why
Why this lesson matters
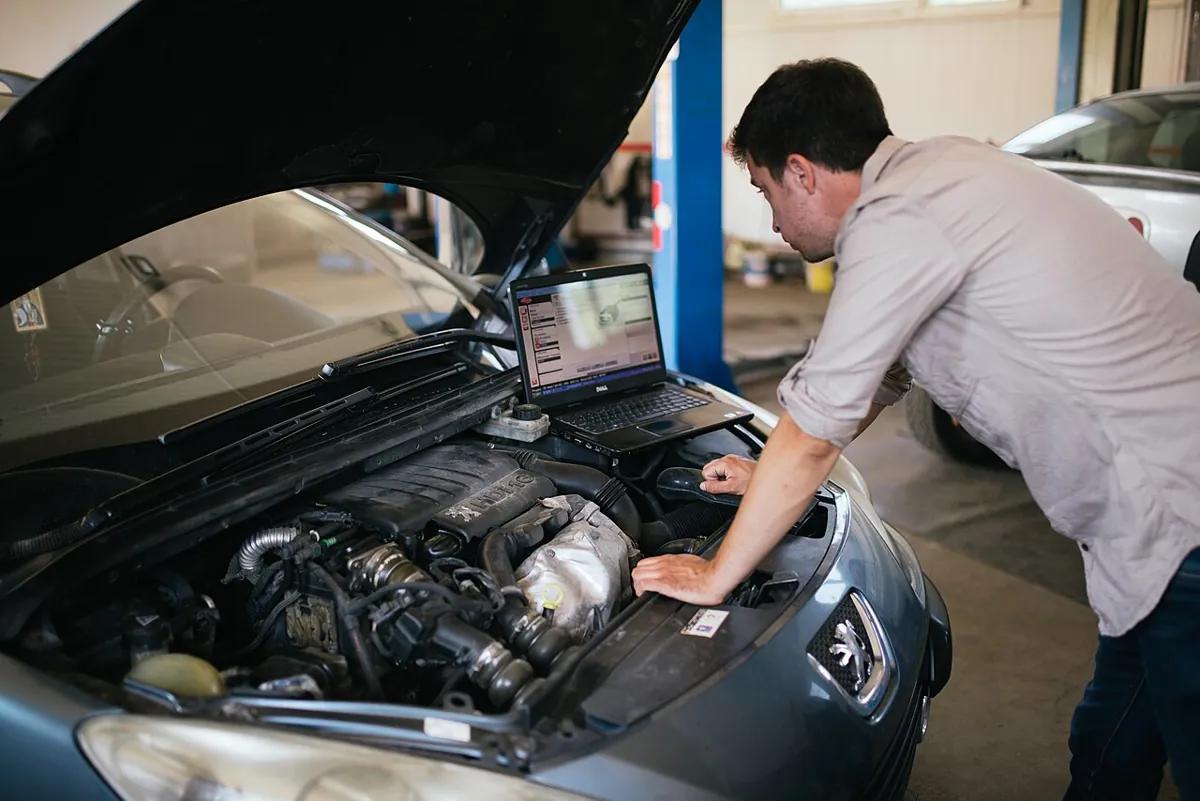
A car mechanic today plugs a laptop into the car and reads what each part is reporting before touching a spanner. A doctor uses a stethoscope and a BP machine before writing medicine. ROS 2 gives you the same kind of instruments: ros2 commands, rqt_graph, rqt_console, ros2 doctor and ros2 bag. They work on any ROS 2 system — yours, a classmate’s, or a big company’s robot.
By the end of this lesson you will be able to: list and inspect nodes, topics, services, actions and parameters; measure a topic’s rate and bandwidth; see the graph in rqt_graph; filter logs by severity in rqt_console; run ros2 doctor; record and replay data with ros2 bag; and follow a fixed checklist to debug your arm.
Concept
The ROS 2 toolbox, tool by tool
The toolbox at a glance
| Question you have | Command | What it tells you |
|---|---|---|
| Which nodes are running? | ros2 node list, ros2 node info <node> | Names, and each node’s publishers, subscribers, services, actions |
| Which topics exist, with which types? | ros2 topic list -t | Topic names with the message type in brackets |
| Who talks on this topic? | ros2 topic info <topic> --verbose | Publisher and subscription count; with -v, each endpoint’s node, type and QoS |
| What is in the messages? | ros2 topic echo <topic> | The live data |
| How fast? | ros2 topic hz <topic> | Average rate, min/max gap, std dev, window |
| How much data? | ros2 topic bw <topic> | Bandwidth and message size |
| Which topics carry this type? | ros2 topic find <type> | Matching topics |
| Services, actions, parameters | ros2 service list -t, ros2 action list -t, ros2 param list | What else each node offers |
| Picture of the whole system | ros2 run rqt_graph rqt_graph | Nodes and topics as a live diagram |
| Logs by severity | ros2 run rqt_console rqt_console | All log messages, filterable |
| Is my setup healthy? | ros2 doctor, ros2 doctor --report | Platform, network and graph checks |
| Save data, replay later | ros2 bag record, info, play | A recording you can study again and again |
Two notes straight from the docs
ros2 topic hzandros2 topic bwmeasure what their own subscription receives. Platform load and QoS can make it differ from the publisher’s real rate.- In
rqt_consolethe severity levels, from most to least severe, are Fatal, Error, Warn, Info, Debug. The default level is Info, so you see Info and everything more severe. Start a node with--ros-args --log-level WARNto hide its Info messages.
ros2 doctor
ros2 doctor checks your platform, versions, network and running graph. If everything is fine it prints All <n> checks passed. Warnings show as UserWarning: — for example Publisher without subscriber detected on /turtle1/pose — and do not mean the setup is broken. Only UserWarning: ERROR: counts as a failed check. ros2 doctor --report prints a full report you can attach when asking for help.
ros2 bag
ros2 bag record -o subset /turtle1/cmd_vel /turtle1/pose records the chosen topics into a folder named subset (in Jazzy the default storage is MCAP, a .mcap file plus metadata.yaml). ros2 bag info subset shows duration, message count per topic and storage id. ros2 bag play subset publishes the messages again with the same timing. Press Ctrl+C to stop recording.
Visual
Visualise it: explore a running system from the terminal
Explore a ROS 2 system from the terminal: list, inspect and measure before you change any code.
Interactive · ROS 2 workspace explorer
ROS 2 communication simulator — educational only (not a live ROS 2 runtime / colcon)

- package.xml
- setup.py
- launch/arm.launch.py
- config/arm.yaml
Pick a command and Run — no real shell.
Code lab
Code lab: find three hidden bugs, then build a health monitor
graph_doctor_sim.py (plain Python, no ROS needed) builds a small fake arm graph with three hidden bugs — a namespace typo, a type mismatch and a USB stall plus a bad sensor reading — and finds each one the way the real tools would: node list, topic list with types, topic info counts, doctor-style warnings, a rate measurement and a bag replay. Run python3 graph_doctor_sim.py.
"""graph_doctor_sim.py - a toy ROS 2 toolbox (plain Python, no ROS 2 needed).

It imitates what these real commands tell you (ROS 2 Jazzy CLI tutorials):
  ros2 node list / ros2 topic list -t / ros2 topic info  -> who publishes and subscribes to what
  ros2 topic hz                                          -> measured message rate
  ros2 doctor                                            -> "publisher without subscriber" style warnings
  ros2 bag record / play                                 -> save messages, replay them later
on a fake 6DOF-arm graph that has three hidden bugs. This is a teaching model, not ros2cli.
"""
import json
import os
import tempfile

# (node, kind, topic, type)
GRAPH = [
    ("/arm1/joint_state_node", "pub", "/arm1/joint_states", "sensor_msgs/msg/JointState"),
    ("/arm1/robot_state_publisher", "sub", "/arm1/joint_states", "sensor_msgs/msg/JointState"),
    ("/arm1/dashboard", "sub", "/arm_1/joint_states", "sensor_msgs/msg/JointState"),       # bug 1: typo
    ("/arm1/shoulder_angle_node", "pub", "/arm1/shoulder_angle_deg", "std_msgs/msg/Float64"),
    ("/arm1/joint_guard", "sub", "/arm1/shoulder_angle_deg", "std_msgs/msg/Float32"),       # bug 2: type
    ("/arm1/camera", "pub", "/arm1/image_raw", "sensor_msgs/msg/Image"),                    # nobody listens
]


def node_list():
    return sorted({n for n, *_ in GRAPH})


def topic_list_t():
    out = {}
    for _, _, topic, typ in GRAPH:
        out.setdefault(topic, set()).add(typ)
    return out


def topic_info(topic):
    pubs = [n for n, k, t, _ in GRAPH if t == topic and k == "pub"]
    subs = [n for n, k, t, _ in GRAPH if t == topic and k == "sub"]
    return pubs, subs


def doctor():
    warnings = []
    for topic, types in topic_list_t().items():
        pubs, subs = topic_info(topic)
        if pubs and not subs:
            warnings.append(f"publisher without subscriber: {topic}")
        if subs and not pubs:
            warnings.append(f"subscriber without publisher: {topic}")
        if len(types) > 1:
            warnings.append(f"type mismatch on {topic}: {sorted(types)}")
    return warnings


def topic_hz(stamps):
    gaps = [b - a for a, b in zip(stamps, stamps[1:])]
    avg = sum(gaps) / len(gaps)
    return 1.0 / avg, min(gaps), max(gaps)


print("Part 1: ros2 node list")
for n in node_list():
    print("  " + n)

print("\nPart 2: ros2 topic list -t")
for topic, types in sorted(topic_list_t().items()):
    print(f"  {topic} [{', '.join(sorted(types))}]")

print("\nPart 3: ros2 topic info for each topic")
for topic in sorted(topic_list_t()):
    pubs, subs = topic_info(topic)
    print(f"  {topic:<28} Publisher count: {len(pubs)}  Subscription count: {len(subs)}")

print("\nPart 4: ros2 doctor (toy) - what looks wrong?")
for w in doctor():
    print("  WARNING " + w)

print("\nPart 5: ros2 topic hz /arm1/joint_states - expected 20 Hz")
# 20 Hz stream, but the USB serial stalls once for 0.4 s
stamps, t = [], 0.0
for i in range(60):
    t += 0.05 if i != 30 else 0.45
    stamps.append(round(t, 3))
rate, lo, hi = topic_hz(stamps)
print(f"  average rate: {rate:.2f}  min: {lo:.3f}s  max: {hi:.3f}s  window: {len(stamps)}")
print("  -> average looks almost fine; the max gap shows the stall")

print("\nPart 6: ros2 bag record, then play back to find a spike")
bag = os.path.join(tempfile.mkdtemp(), "arm_bag.jsonl")
with open(bag, "w") as f:
    for i in range(40):
        angle = 90.0 + i * 0.5 + (35.0 if i == 27 else 0.0)  # one bad pot reading
        f.write(json.dumps({"t": round(i * 0.05, 2), "topic": "/arm1/shoulder_angle_deg", "data": angle}) + "\n")
print(f"  recorded 40 messages to {os.path.basename(bag)}")
prev = None
with open(bag) as f:
    for line in f:
        m = json.loads(line)
        if prev is not None and abs(m["data"] - prev) > 10.0:
            print(f"  replay: jump of {m['data'] - prev:+.1f} deg at t={m['t']}s  (prev {prev:.1f}, now {m['data']:.1f})")
        prev = m["data"]
print("  -> replaying the same data again and again lets you fix the filter without the robot")

print("\nPart 7: the three bugs and the tool that found each")
print("  1. /arm_1/joint_states typo    -> topic list + doctor (subscriber without publisher)")
print("  2. Float64 vs Float32          -> topic list -t (two types on one topic)")
print("  3. USB stall / pot spike       -> topic hz (max gap) and bag replay")
Output (run with python3 graph_doctor_sim.py)
Part 1: ros2 node list
  /arm1/camera
  /arm1/dashboard
  /arm1/joint_guard
  /arm1/joint_state_node
  /arm1/robot_state_publisher
  /arm1/shoulder_angle_node

Part 2: ros2 topic list -t
  /arm1/image_raw [sensor_msgs/msg/Image]
  /arm1/joint_states [sensor_msgs/msg/JointState]
  /arm1/shoulder_angle_deg [std_msgs/msg/Float32, std_msgs/msg/Float64]
  /arm_1/joint_states [sensor_msgs/msg/JointState]

Part 3: ros2 topic info for each topic
  /arm1/image_raw              Publisher count: 1  Subscription count: 0
  /arm1/joint_states           Publisher count: 1  Subscription count: 1
  /arm1/shoulder_angle_deg     Publisher count: 1  Subscription count: 1
  /arm_1/joint_states          Publisher count: 0  Subscription count: 1

Part 4: ros2 doctor (toy) - what looks wrong?
  WARNING subscriber without publisher: /arm_1/joint_states
  WARNING type mismatch on /arm1/shoulder_angle_deg: ['std_msgs/msg/Float32', 'std_msgs/msg/Float64']
  WARNING publisher without subscriber: /arm1/image_raw

Part 5: ros2 topic hz /arm1/joint_states - expected 20 Hz
  average rate: 17.61  min: 0.050s  max: 0.450s  window: 60
  -> average looks almost fine; the max gap shows the stall

Part 6: ros2 bag record, then play back to find a spike
  recorded 40 messages to arm_bag.jsonl
  replay: jump of +35.5 deg at t=1.35s  (prev 103.0, now 138.5)
  replay: jump of -34.5 deg at t=1.4s  (prev 138.5, now 104.0)
  -> replaying the same data again and again lets you fix the filter without the robot

Part 7: the three bugs and the tool that found each
  1. /arm_1/joint_states typo    -> topic list + doctor (subscriber without publisher)
  2. Float64 vs Float32          -> topic list -t (two types on one topic)
  3. USB stall / pot spike       -> topic hz (max gap) and bag replay
Try it: type ros2 commands in the sandbox and explore nodes, topics and packages.
Interactive · ROS 2 workspace explorer
ROS 2 communication simulator — educational only (not a live ROS 2 runtime / colcon)
- package.xml
- setup.py
- launch/arm.launch.py
- config/arm.yaml
Pick a command and Run — no real shell.
arm_health_monitor.py — a node that watches another node
The CLI is for you. This node does the same checks all the time: it subscribes to joint_states, counts messages, tracks the biggest gap and big jumps, and logs at the right level — Debug per message, Info every 2 s when healthy, Warn when slow or jumpy, Error when nothing arrives. Open rqt_console and watch the levels.
"""arm_health_monitor.py - watch an arm's joint_states and log problems (rclpy, ROS 2 Jazzy).

Subscribes to joint_states (relative name, so it follows the namespace), measures the rate,
the largest gap and big jumps between messages, and logs with the right severity:
  DEBUG every message, INFO a summary every 2 s, WARN slow rate / jumps, ERROR no data at all.
See the messages in the terminal or in rqt_console.

ros2 run arm_control arm_health_monitor --ros-args -r __ns:=/arm1 -p expected_hz:=20.0
ros2 run arm_control arm_health_monitor --ros-args -r __ns:=/arm1 --log-level debug
"""
import math

import rclpy
from rclpy.node import Node
from sensor_msgs.msg import JointState


class ArmHealthMonitor(Node):
    def __init__(self):
        super().__init__('arm_health_monitor')
        self.declare_parameter('expected_hz', 20.0)
        self.declare_parameter('max_jump_deg', 10.0)
        self.create_subscription(JointState, 'joint_states', self.on_state, 10)
        self.create_timer(2.0, self.report)
        self.count = 0
        self.last_time = None
        self.max_gap = 0.0
        self.last_pos = {}

    def on_state(self, msg):
        now = self.get_clock().now().nanoseconds * 1e-9
        if self.last_time is not None:
            self.max_gap = max(self.max_gap, now - self.last_time)
        self.last_time = now
        self.count += 1
        limit = self.get_parameter('max_jump_deg').value
        for name, pos in zip(msg.name, msg.position):
            old = self.last_pos.get(name)
            if old is not None and abs(math.degrees(pos - old)) > limit:
                self.get_logger().warn(
                    f'{name} jumped {math.degrees(pos - old):+.1f} deg in one message')
            self.last_pos[name] = pos
        self.get_logger().debug(f'joint_states #{self.count}: {len(msg.name)} joints')

    def report(self):
        expected = self.get_parameter('expected_hz').value
        rate = self.count / 2.0
        if self.count == 0:
            self.get_logger().error('no joint_states for 2 s - is the publisher running? '
                                    'check: ros2 topic info joint_states')
        elif rate < 0.8 * expected:
            self.get_logger().warn(f'rate {rate:.1f} Hz (expected {expected:.0f}), '
                                   f'max gap {self.max_gap:.3f} s')
        else:
            self.get_logger().info(f'ok: {rate:.1f} Hz, max gap {self.max_gap:.3f} s, '
                                   f'{len(self.last_pos)} joints')
        self.count = 0
        self.max_gap = 0.0


def main():
    rclpy.init()
    node = ArmHealthMonitor()
    try:
        rclpy.spin(node)
    except KeyboardInterrupt:
        pass
    finally:
        node.destroy_node()
        rclpy.try_shutdown()


if __name__ == '__main__':
main()ros2 node list
ros2 node info /arm1/joint_state_node
ros2 topic list -t
ros2 topic info /arm1/joint_states --verbose
ros2 topic echo /arm1/joint_states
ros2 topic hz /arm1/joint_states
ros2 topic bw /arm1/joint_states
ros2 topic find sensor_msgs/msg/JointState
ros2 run rqt_graph rqt_graph
ros2 run rqt_console rqt_console
ros2 run arm_control arm_health_monitor --ros-args -r __ns:=/arm1 --log-level WARN
ros2 doctor
ros2 doctor --report
ros2 bag record -o arm_test /arm1/joint_states # Ctrl+C to stop
ros2 bag info arm_test
ros2 bag play arm_testarm_snapshot.sh — one command, one folder to share
When you ask a mentor for help, “it is not working” is not enough. This script saves the doctor report, node/topic/service/action lists, topic info, 10 s of rate and a 10 s bag into one folder. It uses timeout -s INT so ros2 bag record stops as if you pressed Ctrl+C.
#!/usr/bin/env bash
# arm_snapshot.sh - save a "health snapshot" of a running ROS 2 system into one folder.
# Every command here is from the ROS 2 Jazzy CLI tutorials. Usage: ./arm_snapshot.sh /arm1
set -u
NS="${1:-/arm1}"
OUT="snapshot_$(date +%Y%m%d_%H%M%S)"
mkdir -p "$OUT"

ros2 doctor --report            > "$OUT/doctor_report.txt" 2>&1
ros2 node list                  > "$OUT/nodes.txt"
ros2 topic list -t              > "$OUT/topics.txt"
ros2 service list -t            > "$OUT/services.txt"
ros2 action list -t             > "$OUT/actions.txt"
ros2 topic info "$NS/joint_states" --verbose > "$OUT/joint_states_info.txt" 2>&1

# 10 seconds of rate and data
timeout -s INT 10 ros2 topic hz "$NS/joint_states" > "$OUT/joint_states_hz.txt" 2>&1
timeout -s INT 10 ros2 bag record -o "$OUT/bag" "$NS/joint_states" > "$OUT/bag_log.txt" 2>&1
ros2 bag info "$OUT/bag"        > "$OUT/bag_info.txt" 2>&1

echo "Saved to $OUT/ - attach this folder when you ask for help."
Real world
Debugging tools in the real world
- turtlesim (official tutorials): every tool in this lesson is taught on turtlesim first —
rqt_graph,topic hz,rqt_consolewith--log-level WARN,ros2 doctor,ros2 bag. - Field robots: teams record bags during a test run, then replay them in the office to tune filters and planners without the robot.
- Teaching labs: a student shares a
ros2 doctor --reportand a short bag instead of a long WhatsApp message — the mentor can see the problem. - Your 6DOF arm: the health monitor runs in every launch file from now on, so problems show up in the log before anyone notices them on the arm.
ros2 bag is the flight recorder of your robot.Photo: Beko · CC BY-SA 4.0 · Source: Wikimedia Commons · resized, converted to WebP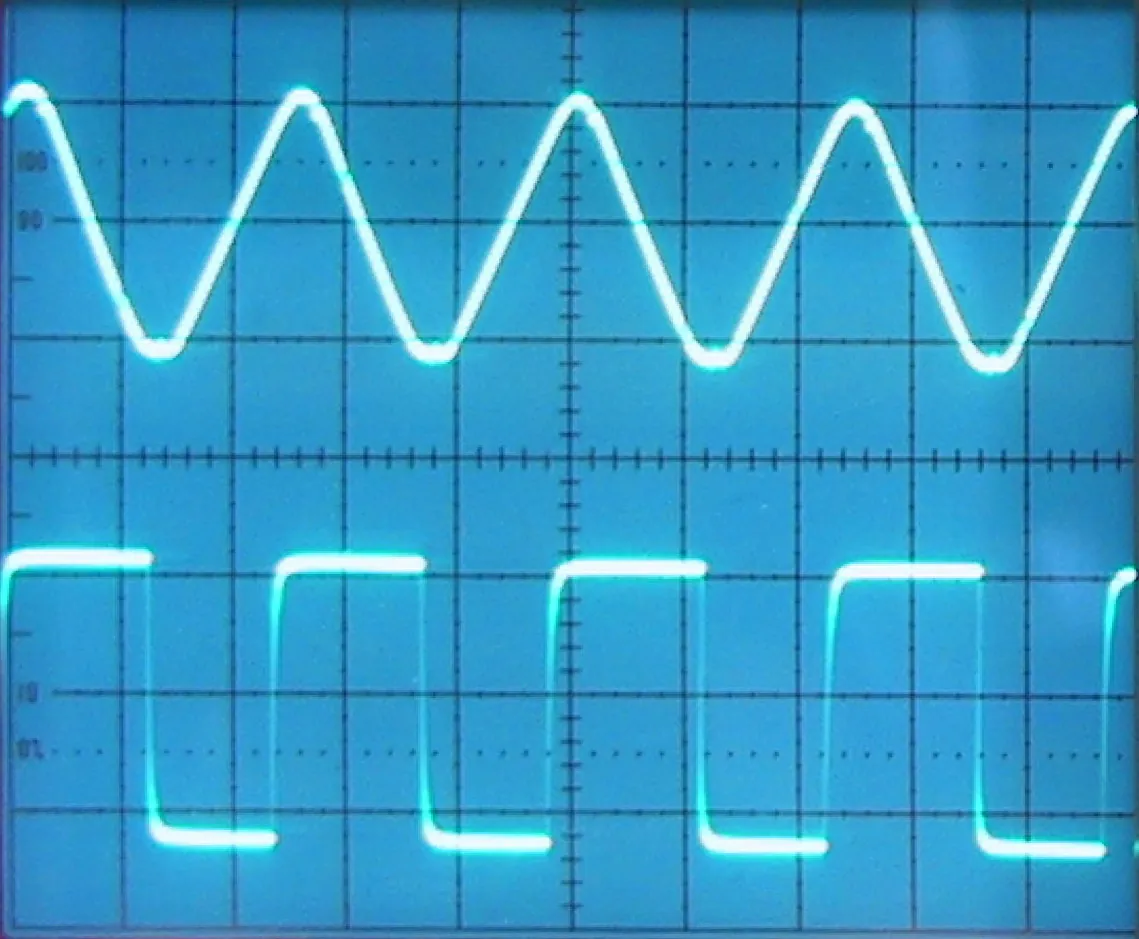
ros2 topic hz is your timing view — read the gaps, not only the average.Photo: Xato · CC0 · Source: Wikimedia Commons · resized, converted to WebPBench build
Bench build: debug a real sensor stream with the toolbox
Reuse the two-potentiometer board from Lesson 4 and joint_state_node.py from Lesson 5. No motors this time — only sensors, so it is safe to wiggle and unplug things on purpose to create bugs.
| From | To | Note |
|---|---|---|
| Pot 1 outer legs | Arduino 5V and GND | 10 kΩ pot |
| Pot 1 middle (wiper) | A0 | Shoulder |
| Pot 2 outer legs | Arduino 5V and GND | 10 kΩ pot |
| Pot 2 middle (wiper) | A1 | Elbow |
| Arduino USB | ROS 2 computer | 115200 baud, 20 Hz lines like s:93.2,e:71.0 |
// two_pot_stream.ino - stream two potentiometer "joint angles" at 20 Hz.
// Output lines look like:  s:93.2,e:71.0
// Read by two_joint_publisher.py (-p port:=/dev/ttyACM0). Drives NO motors.
// Wiring: each 10k pot - outer legs to 5V and GND, middle (wiper) to A0 (shoulder) / A1 (elbow).

const unsigned long PERIOD_MS = 50;  // 20 Hz
unsigned long last = 0;

float toDeg(int raw) { return raw * (180.0 / 1023.0); }

void setup() {
  Serial.begin(115200);
}

void loop() {
  unsigned long now = millis();
  if (now - last < PERIOD_MS) return;
  last = now;
  float s = toDeg(analogRead(A0));
  float e = toDeg(analogRead(A1));
  Serial.print("s:");
  Serial.print(s, 1);
  Serial.print(",e:");
  Serial.println(e, 1);
}Start the stream
python3 joint_state_node.py --ros-args -r __ns:=/arm1 -p port:=/dev/ttyACM0Start the monitor
ros2 run arm_control arm_health_monitor --ros-args -r __ns:=/arm1and openrqt_console.Measure
ros2 topic hz /arm1/joint_statesshould show about 20. Note min and max.Make a typo bug
Restart the monitor with
-r __ns:=/arm_1. Find it withros2 topic info(0 publishers) andros2 doctor.Make a jump
Turn a pot fast. The monitor warns about a jump. Record with
ros2 bag record -o fast_turn /arm1/joint_states, then replay withros2 bag play fast_turnwhile the Arduino is unplugged — the monitor sees the same jumps again.Make a stall
Unplug the USB for a few seconds: the monitor logs an Error. Plug in and restart the stream node.
Debugging
A fixed debugging checklist
| Symptom | Command to run | What you will usually find |
|---|---|---|
| Node “not doing anything” | ros2 node list, ros2 node info | Node not running, or in a different namespace |
| Subscriber gets nothing | ros2 topic info <topic> -v | 0 publishers: typo or namespace; QoS mismatch shown in the endpoint details |
| Data looks wrong | ros2 topic echo | Degrees vs radians, wrong joint order |
| Robot is jerky | ros2 topic hz | Big max gap: USB stall, slow loop |
| Too many messages to read | rqt_console, --log-level WARN | Filter to Warn and above |
| “Works on my laptop only” | ros2 doctor --report | Different distro, network or middleware settings |
| Bug happens once a day | ros2 bag record | Record, then replay as often as you need |
Think
Think about it
Think
Your arm moves smoothly on your laptop but jerks on the lab PC. Which three commands would you run first, in what order, and what would each one rule out?
Experiment
Try it in the lab
About 40 minutes with Python; the ROS 2 steps need ROS 2 Jazzy with turtlesim; the bench step needs the two-pot board from Lesson 4.
Experiment
Plant a bug, catch it with tools only
You will need
- `graph_doctor_sim.py` and Python 3
- Workspace explorer (in your browser)
- Optional: ROS 2 Jazzy, turtlesim, rqt, `arm_health_monitor.py`, Arduino UNO with two 10 kΩ pots
Steps
- Run `graph_doctor_sim.py`. Add a fourth bug — a node subscribed to `/arm1/joint_state` (missing “s”) — and check that the doctor part catches it.
- Change the stall in Part 5 to 0.15 s. Is it still visible in the average? In the max?
- With ROS 2: follow the topics tutorial on turtlesim — `rqt_graph`, `topic echo`, `topic hz`, `topic bw`.
- With ROS 2: run `ros2 doctor`, then start turtlesim and run it again. Read the publisher-without-subscriber warnings.
- With ROS 2: record a bag of `/turtle1/cmd_vel` while driving, check `ros2 bag info`, and play it back.
- Bench: do the typo, jump and stall bugs from the bench build and write which tool caught each.
Interactive · ROS 2 workspace explorer
ROS 2 communication simulator — educational only (not a live ROS 2 runtime / colcon)
- package.xml
- setup.py
- launch/arm.launch.py
- config/arm.yaml
Pick a command and Run — no real shell.
Most ROS 2 bugs are visible from outside: a wrong name, a missing node, a slow topic, a strange value. The tools find them faster than reading code.
Knowledge check
Check your understanding
Knowledge check
1. Which command shows topics with their message types?
2. `ros2 topic info /arm_1/joint_states` shows 0 publishers and 1 subscription. Most likely cause?
3. `ros2 topic hz` measures…
4. The default logger level shown in rqt_console is…
5. `ros2 doctor` prints `UserWarning: Publisher without subscriber`. Does that mean the check failed?
6. What is the default bag storage format in ROS 2 Jazzy?
7. Why is replaying a bag of command topics to a powered arm dangerous?
Mini assignment
Hands-on assignment
Mini assignment
A debugging kit for your 6DOF arm
Build the tools you will use every time your arm misbehaves, and prove they catch real bugs.
Deliverables
- Output of `graph_doctor_sim.py` with your extra bug added and caught.
- A one-page checklist (your own words) of which command to run for which symptom.
- Optional (ROS 2): `rqt_graph` screenshot, `ros2 doctor` output and `ros2 bag info` of a recording.
- Optional (bench): a table of the three planted bugs, the tool that caught each, and a screenshot of the monitor’s warnings in rqt_console.
Do this, step by step
- Run
python3 graph_doctor_sim.pyand add the/arm1/joint_statetypo bug; check that it is caught. - Change the Part 5 stall to 0.15 s and compare the average and max timing.
- Write a one-page checklist: which command (
topic list,topic hz,topic echo,node info,doctor,bag) for which symptom. - Optional with ROS 2: record a short bag, run
ros2 bag info, and play it back. - Optional bench: plant the typo, jump and stall bugs and write which tool caught each.
Stuck? Hints, one at a time
- A typo creates a second topic with no publisher —
ros2 topic listshows both names side by side. - Averages hide short stalls; look at the max (or the jitter) to catch them.
ros2 topic hztells you the rate;ros2 topic echotells you the values — use both.
Challenges (pick by level)
- 🟢 Easy: Run every command in the “toolbox at a glance” table on turtlesim and write one line on what each told you.
- 🟡 Medium: Add a
stale_after_sparameter toarm_health_monitor.pythat logs an Error when no message arrives for that long (check it in a timer). - 🟠 Hard-ish: Extend
arm_snapshot.shto also saveros2 param dumpfor every node in the namespace. - 🔴 Hard: Record a bag of the pot stream, write a small script that reads the replayed data and prints the worst gap and biggest jump, and compare with the monitor.
- ⚫ Research: Read the
ros2 bagtutorial section on recording services and explain how service introspection could help debug Lesson 6’smove_jointcalls.
Next step
Your toolbox can see topics and data. But a robot arm also needs to know where things are — the gripper relative to the base, the camera relative to the table. In Lesson 12 — TF2 & Coordinate Frames you will meet the tool ROS 2 uses for that.
Look back: Lesson 10: Parameters & Configuration. Next: Lesson 12: TF2 & Coordinate Frames. Related: Stage 3 — Linux & Dev Environment.
Sources
- ROS 2 Jazzy docs — Understanding topics —
rqt_graph,topic list -t,echo,info --verbose,hz(receiving rate note),bw,find. - ROS 2 Jazzy docs — Using rqt_console to view logs — levels Fatal/Error/Warn/Info/Debug, default Info,
--ros-args --log-level WARN. - ROS 2 Jazzy docs — Recording and playing back data —
ros2 bag record -o,info,play, MCAP storage id. - ROS 2 Jazzy docs — Using ros2doctor —
All <n> checks passed, UserWarning vs ERROR, publisher-without-subscriber warnings,--report. - Docs text read from the official docs source ros2/ros2_documentation (jazzy branch).
- Photos: Wikimedia Commons (credits under each image).
Self-attested for now — keep artifacts in your lab notebook.
Complete
Today's goal
0 of 1 done today
Mark this lesson complete when you have worked the experiment, knowledge check, and assignment (even roughly).